2020 is upon us, and Wyoming’s future hangs in the balance, and it doesn’t look like we’re going to weather the storm.
Before getting started, please take a moment to pause and note that everyone in our legislature and elected offices act with the best of intentions, doing their best for their constituents and Wyoming in general. Without a single reservation, Wyoming and its government of citizen legislators are better off than our sister states are with their paid full-time professional politicians/legislators.
That said, the nature of politics is disagreement. How legislative leadership manages that disagreement shapes the legislative session and ultimately determines Wyoming’s future.
In states where there is a more even divide between Democrats and Republicans, that disagreement is fought out more openly between the political parties. In Wyoming, the Democrats are on life support, and Republicans have what even a few years ago would have been thought to be unthinkable supermajorities. Yet, despite these vast ‘Republican’ advantages in numbers, somehow policies that are generally rejected by Republicans across the state remain on the agenda for the 2020 legislative session. We have to ask, “Why?”. We must dig deep to glean an understanding of our legislature, its leadership, and, ultimately, the direction of Wyoming.
While policy debate is often exciting, passionate and educational, no single policy or position can give us an understanding of Wyoming’s future. Instead, we need to look for information that removes personal and issue political bias from the discussion of ‘why’ rejected positions are supported by Republican legislators.
One such source of information could be the voting record from the 2019 legislative session. The voting record provides unique insight into the inner working of the legislature. It has the advantage of being readily available and readily verifiable.
The voting record covers no less than 2800 votes spread among more than 500 house bills, senate files and a smattering of resolutions. 861 of the votes provide detail how individual legislators voted by virtue of being “roll call votes”. In these roll call votes are 453 recorded votes of the ‘Committee of the Whole,’ which is the entire Wyoming House of Representatives. The remaining roll call votes were reported by the various committees of the House of Representatives.
It’s vital to understand that 312 of the 453 roll call votes taken by Committee of the Whole passed bills by less than ten (10) votes. This extensive data set enables us to address specific questions, free of our individual biases, and, given the sheer number of issues covered by the bills, free from any prejudice arising from single issues.
When we take each legislator’s self-declared party affiliation, we can answer questions like “how does the average Republican or Democrat legislator vote” based on hard, verifiable data free from our own or external political bias.
Armed with voting record data, we can answer the question, “Does an individual legislator tend to vote with Republican Speaker of the House or The Democrat Minority Floor Leader?” We can compute the percentage of time each legislator’s votes agreed with the Republican Speaker of the House Harshman and with Democrat Minority Floor Leader Connolly for the entire 2019 legislative session.
Here is a table of those results:
| Legislator | % Agrees with Connolly | % Agrees with Harshman |
|---|---|---|
| Rep Connolly – D | 100.0% | 83.0% |
| Rep Pelkey – D | 95.7% | 84.2% |
| Rep Yin – D | 94.8% | 81.1% |
| Rep Clifford – D | 93.2% | 83.8% |
| Rep Schwartz – D | 92.8% | 83.6% |
| Rep Burlingame – D | 92.3% | 84.8% |
| Rep Dayton-Selman – D | 92.2% | 84.6% |
| Rep Blake – D | 91.2% | 86.1% |
| Rep Freeman – D | 90.6% | 85.8% |
| Rep Roscoe – D | 89.3% | 83.2% |
| Rep Barlow – R | 86.7% | 87.3% |
| Rep Kirkbride – R | 86.4% | 87.3% |
| Rep Zwonitzer – R | 84.4% | 85.0% |
| Rep Northrup – R | 84.3% | 89.6% |
| Rep Kinner – R | 84.3% | 88.8% |
| Rep Obermueller – R | 84.2% | 90.0% |
| Rep Haley – R | 84.1% | 87.9% |
| Rep Paxton – R | 84.1% | 86.8% |
| Rep Furphy – R | 83.7% | 87.9% |
| Rep Newsome – R | 83.6% | 84.1% |
| Rep Duncan – R | 83.4% | 85.4% |
| Rep Harshman – R | 83.0% | 100.0% |
| Rep Sweeney – R | 82.6% | 83.4% |
| Rep Crank – R | 81.8% | 84.8% |
| Rep Brown – R | 81.8% | 82.3% |
| Rep Sommers – R | 81.1% | 83.7% |
| Rep Simpson – R | 81.0% | 85.1% |
| Rep MacGuire – R | 80.7% | 88.1% |
| Rep Henderson – R | 80.0% | 86.3% |
| Rep Stith – R | 79.7% | 85.0% |
| Rep Eklund – R | 79.5% | 87.0% |
| Rep Eyre – R | 78.6% | 83.7% |
| Rep Nicholas-B – R | 78.6% | 86.3% |
| Rep Western – R | 78.5% | 83.9% |
| Rep Wilson – R | 77.3% | 80.5% |
| Rep Flitner – R | 76.4% | 82.5% |
| Rep Hunt – R | 75.9% | 82.3% |
| Rep Olsen – R | 75.9% | 83.6% |
| Rep Larsen – R | 75.8% | 86.1% |
| Rep Hallinan – R | 75.3% | 78.6% |
| Rep Walters – R | 74.5% | 81.8% |
| Rep Pownall – R | 74.4% | 81.3% |
| Rep Blackburn – R | 74.1% | 78.0% |
| Rep Clausen – R | 73.0% | 76.4% |
| Rep Lindholm – R | 72.6% | 78.5% |
| Rep Burkhart – R | 72.3% | 82.5% |
| Rep Piiparinen – R | 72.0% | 74.7% |
| Rep Loucks – R | 71.9% | 80.2% |
| Rep Tass – R | 70.6% | 78.7% |
| Rep Winter – R | 70.3% | 75.5% |
| Rep Washut – R | 70.2% | 76.4% |
| Rep Salazar – R | 68.5% | 74.4% |
| Rep Clem – R | 67.7% | 70.9% |
| Rep Greear – R | 67.0% | 79.4% |
| Rep Styvar – R | 65.5% | 69.8% |
| Rep Miller – R | 62.7% | 70.8% |
| Rep Laursen – R | 62.6% | 70.5% |
| Rep Gray – R | 61.2% | 67.4% |
| Rep Jennings – R | 56.8% | 63.1% |
| Rep Edwards – R | 52.8% | 57.5% |
Figure 1 – Comparing legislator voting history voted compared to the Speaker of the House Harshman and the Minority Floor Leader Connolly
The table aids us in calculating what an “average Democrat” and “average Republican” look like by calculating the average of the agreement for all Democrats and all Republicans separately.
Even so, the table represents a significant amount of data, and it helps to view the data visually, plotting the agreement with the Minority Floor Leader on the vertical axis and the agreement with the Speaker of the House on the horizontal axis. This gives us a better view of the data, especially when we add the ‘average Democrat’ (noted as the blue *MEAN*), the average Republican (indicated as the red *MEAN*), and the average for the entire House (indicated by the grey *MEAN*):
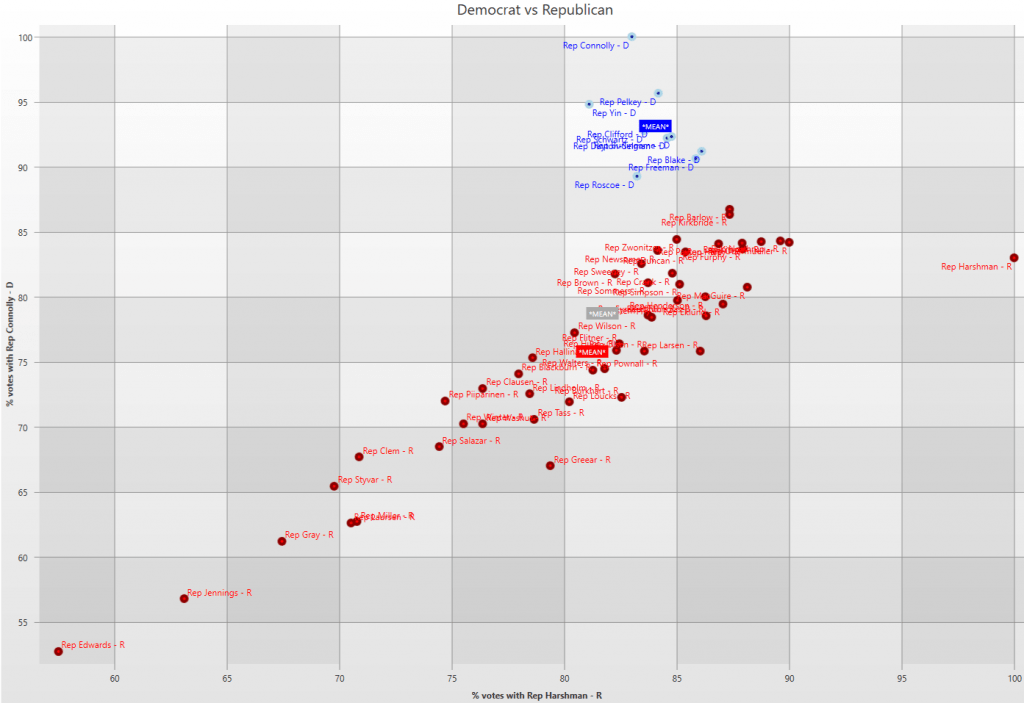
Figure 2 – Legislator voting pattern
If we look only at the legislators that agree with the Minority Floor Leader more often than the ‘average’ legislator, we get a little different picture. Specifically, a large number of Republicans, nineteen to be exact, agree with the Minority Floor Leader more than the average legislator.
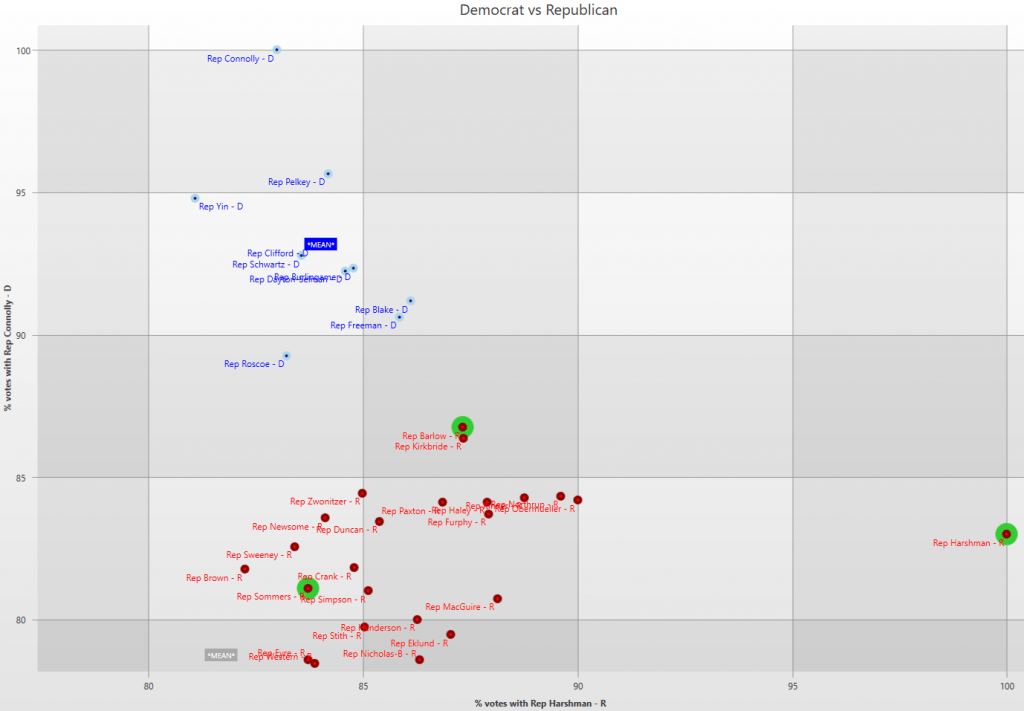
Figure 3 – Legislator votes highlighting select Republican Leadership
If we highlight Republican leadership, we see a troubling fact. Specifically, Republican House Leadership of Harshman, Sommers, and Barlow votes with surprisingly high affinity with Minority Floor Leader Connolly. The agreement is so profound they align themselves with the Democrats more than an average member of the House, regardless of party.
There’s more to learn as we can measure the distance between the Average Republican and the Average Democrats to learn which party a legislator is more likely to side with on any given issue. No fewer than 10 Republicans are closer to the average Democrat rather than the Average Republican. Shockingly this includes the Speaker of the House and the Majority Floor leader:
| Legislator | Closest Average |
|---|---|
| Rep Barlow – R | Democrat |
| Rep Blake – D | Democrat |
| Rep Burlingame – D | Democrat |
| Rep Clifford – D | Democrat |
| Rep Connolly – D | Democrat |
| Rep Dayton-Selman – D | Democrat |
| Rep Freeman – D | Democrat |
| Rep Furphy – R | Democrat |
| Rep Haley – R | Democrat |
| Rep Harshman – R | Democrat |
| Rep Kinner – R | Democrat |
| Rep Kirkbride – R | Democrat |
| Rep Northrup – R | Democrat |
| Rep Obermueller – R | Democrat |
| Rep Paxton – R | Democrat |
| Rep Pelkey – D | Democrat |
| Rep Roscoe – D | Democrat |
| Rep Schwartz – D | Democrat |
| Rep Yin – D | Democrat |
| Rep Zwonitzer – R | Democrat |
Figure 4- Who votes closer to the average Democrat legislator, Republicans highlighted
So where is our Republican House of Representatives Leadership team taking Wyoming? What conclusions can we draw from Republican House Leadership being more aligned with the Democrats than their own party?
Liberal, or Democrat, policies generally result in increased taxes, increased regulation and decreased economic growth. Is it too far a stretch to say that
Keep in mind, 312 of the 453 roll call votes taken by the Committee of the Whole passed bills by less than ten (10) votes. And there are 10 Republicans closer to voting with Democrats then their own party on average.
As an anecdotal test, why does Medicaid expansion keep being brought up in the legislature? If you consider Rep. Barlow has tried no fewer than three different times via all manner of legislative ploys to get Wyoming to adopt Medicaid Expansion and he is one of the people to set the agenda. Lo-and-behold Medicaid Expansion is back on the docket despite having defeated every year since its introduction with Obamacare. The proof
I pray for our state, our mineral workers, our economy, our citizens, and our Grand Old Party that Messrs. Barlow, Harshman and Sommers will rise to the occasion and prove this wrong. Perhaps if we communicated to our Republicans legislators that we believe the only way out of this is along with old-fashioned conservative values, we could help them save Wyoming.